
Know where you stand against plan, and how early you could have known.
For hospital and health system leaders who want finance, revenue cycle, and operations analytics that read like they were built by someone who has run the budget.

Questions we build dashboards around
- Budget vs. actual. Where volume and revenue are running against plan, and why.
- Forecasting. Driver-based scenarios and variance, so guidance is less of a surprise.
- Payer mix and contract yield. How coverage shifts show up in net revenue.
- Claims and revenue cycle. Denials, accounts receivable, and cash collections.
- Service-line margin. Which lines contribute, and which are slipping.
- Performance. Physician, facility, and quality views in the same place.
Why an operator's view helps
Our founder spent more than fifteen years as a hospital and division CFO. The dashboards reflect how hospitals actually operate, not how a data model assumes they do.
Start with one division
We suggest scoping the first engagement to a single division: large enough to prove the analytics, small enough to move quickly. The platform is cloud-based, so the technical ask is one secure data pipeline. At the end you receive a written plan to scale, with scope, sequence, cost, and timeline.
The analytics suite for hospitals and health systems
Clinical analytics and financial intelligence on one platform. This is our standard recommended set. More modules are in development, and additional reports are available beyond the dashboards. Open the image to see it full size, or read the list below.
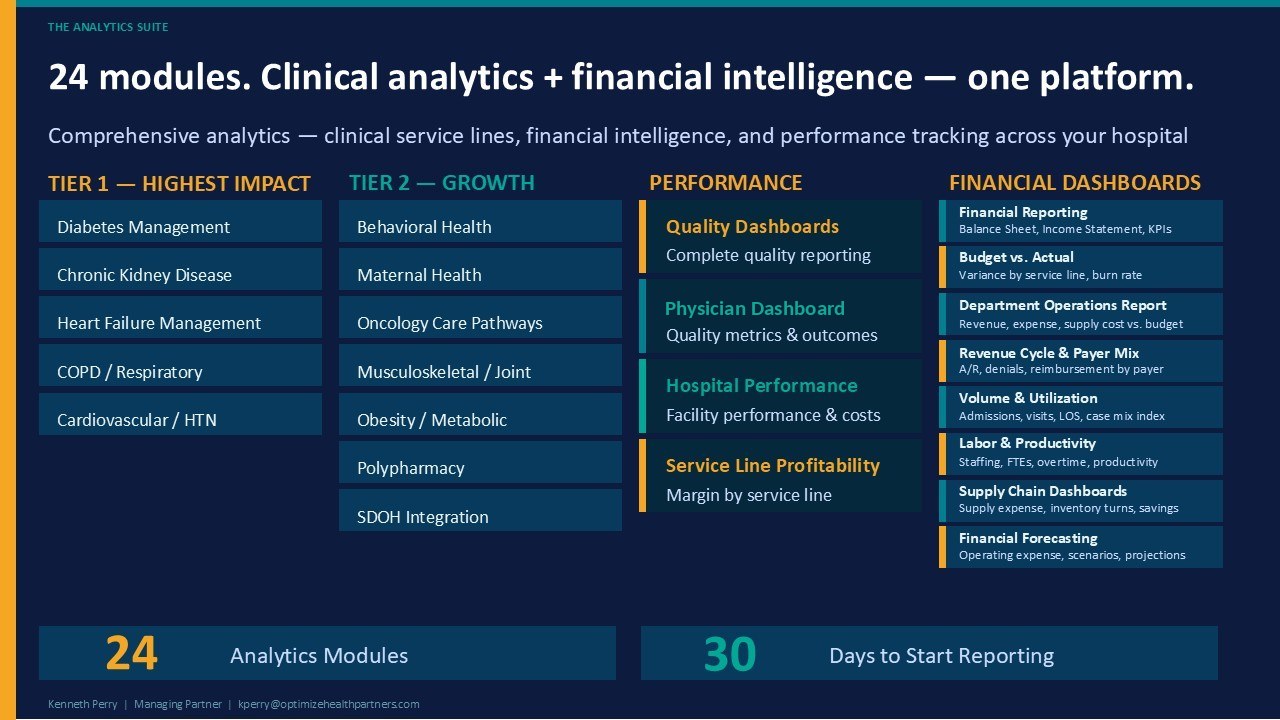
Read the list as text
Tier 1: highest impact
- Diabetes Management
- Chronic Kidney Disease
- Heart Failure Management
- COPD / Respiratory
- Cardiovascular / HTN
Tier 2: growth
- Behavioral Health
- Maternal Health
- Oncology Care Pathways
- Musculoskeletal / Joint
- Obesity / Metabolic
- Polypharmacy
- SDOH Integration
Performance
- Quality DashboardsComplete quality reporting
- Physician DashboardQuality metrics & outcomes
- Hospital PerformanceFacility performance & costs
- Service Line ProfitabilityMargin by service line
Financial dashboards
- Financial ReportingBalance Sheet, Income Statement, KPIs
- Budget vs. ActualVariance by service line, burn rate
- Department Operations ReportRevenue, expense, supply cost vs. budget
- Revenue Cycle & Payer MixA/R, denials, reimbursement by payer
- Volume & UtilizationAdmissions, visits, LOS, case mix index
- Labor & ProductivityStaffing, FTEs, overtime, productivity
- Supply Chain DashboardsSupply expense, inventory turns, savings
- Financial ForecastingOperating expense, scenarios, projections
Thirty minutes, with your numbers in mind.
Tell us the gap you are trying to close or the forecast you want sooner.